
This page explains every section of our data tool with the use of images. Every filter and statistic is explained in full.
For creative ways to use this tool, please see the homepage here. Feedback and suggestions are welcome for this tool via our Twitter page.
RacingData Filters Explained:
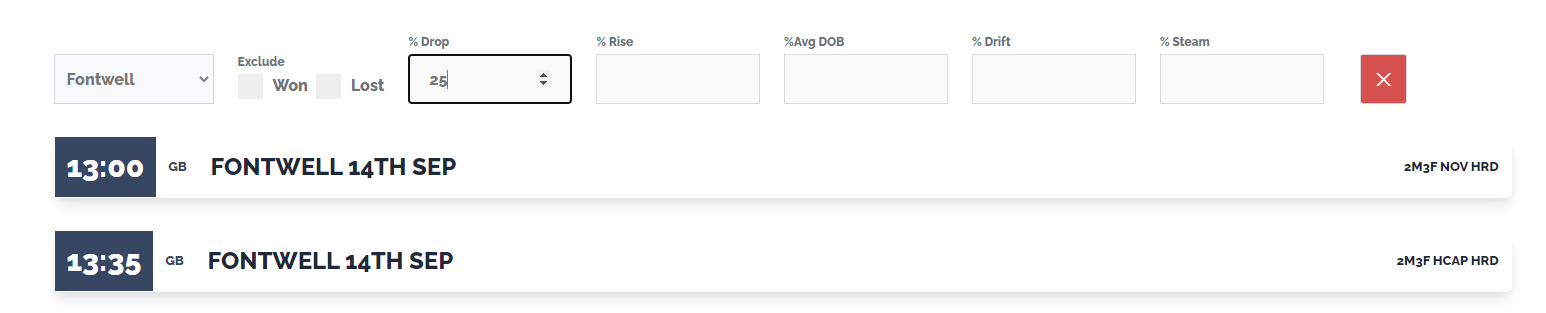
At the top of the tool, you will see the main filter. Results that are displayed below the filter will change automatically as you input or remove variables.
For example, in the image below you can see that Fontwell has been selected and % Drop is set to 25. This means that all outcomes beyond this criteria have been removed from the displayed results.
Removing 25 from the % Drop filter and deselecting Fontwell restores the daily information in full, as seen below.
![]()
There are currently 8 filters to use. Selecting multiple filters provides a fast and efficient way of resolving your query and highlighting daily opportunities.
Selecting a track
Some tracks are less effective on different surfaces and race types (for example flat racing and all-weather). Therefore, this filter allows you to refine information based upon the days racing.
Excluding Won
Winning results can distort in-play data and average prices. By checking this filter, all winning results will be excluded from the filtered information. This filter is particularly useful when looking at data that reflects a horses in running habits.
Excluding Lost
Losing results can also distort in-play data and average prices. Checking this filter will exclude all losing results from the filtered results allowing you a clearer understanding of the horses running style.
% Drop (In-Play Data)
This statistical figure represents the amount a selections price has reduced in running. As a filter, you can exclude all average % Drop results that do not match or exceed the number specified. For example, if you input 80, all results that do not have an average price drop of 80% or more will be excluded from the results table. Using the Exclude Won/Lost checkbox works well with this feature.
The % Drop figure is displayed as an average within Mid Level results and individually within Bottom Level results. See the 3 interface levels for further clarity at the bottom of this page.
% Rise (In-Play Data)
This statistical figure represents the amount a selections price has increased in running. As a filter, you can exclude all average % Rise results that do not match or exceed the number specified. For example, if you input 40, all results that do not have an average price rise of 40% or more will be excluded from the results table. Using the Exclude Won/Lost checkbox works well with this feature.
The % Rise figure is displayed as an average within Mid Level results and individually within Bottom Level results. See the 3 interface levels for further clarity at the bottom of this page.
% Avg DOB
Specifying a figure in this filter will exclude horses that do not meet the average DOBBING* percentage. For example, inputting 50 would only display horses that have historically DOBBED* at a rate of 50% or more. Those who have DOBBED* less than half of the time would be excluded.
*DOB is an in-running betting term that stands for Double Or Bust. For a horse to DOB, its price must contract 50% or more. Backing a horse at the starting price and laying the same bet at a 50% of the price in-play would see you double your stake if the lay bet is matched. If the price fails to contract by 50% then the lay bet will not be matched and you would lose your stake, going bust. This is where the term originates.
% Drift (Pre Race Data)
This statistic is a simple figure that displays the percentage difference between the horses BSP and the lowest traded price before the race started. We are unable to track the time at which bets were matched although this should provide a general indication of price movement. As an average statistic, you will see some horses routinely move in one direction.
This statistic is also available for individual results on the Bottom Level, explained at the bottom of this page.
% Steam (Pre Race Data)
This statistic is a simple figure that displays the percentage difference between the horses BSP and the highest traded price before the race started. We are unable to track the time at which bets were matched although this should provide a general indication of price movement. As an average statistic, you will see some horses routinely move in one direction.
This statistic is also available for individual results on the Bottom Level, explained at the bottom of this page.
RacingData Interface Explained (The 3 Levels):
There are 3 levels to the RacingData interface. It may appear confusing at first, although it’s extremely simple once you understand them. Follow along as we explain each level individually.
Top Level – Daily Selections
Each day the tools information is updated with the day’s information and historical performance pricing. You can peruse the information by clicking on individual races, selections and performances. To filter specific results please refer to the sub-heading further up this page.
This is how the top-level appears:

By clicking on the 13:00 GB Fontwell 14th Sep row you will be presented with the next level, shared below.
Mid Level – Horse Racing Selections Data & Averages
This level of information becomes more refined. You are now looking at this races information alone. Take a look at the image below to see horses historical data within this race. This level provides a clear overview of individual horses and their averages (further detail on the next interface level).
Clicking the race title takes you back to the previous level.
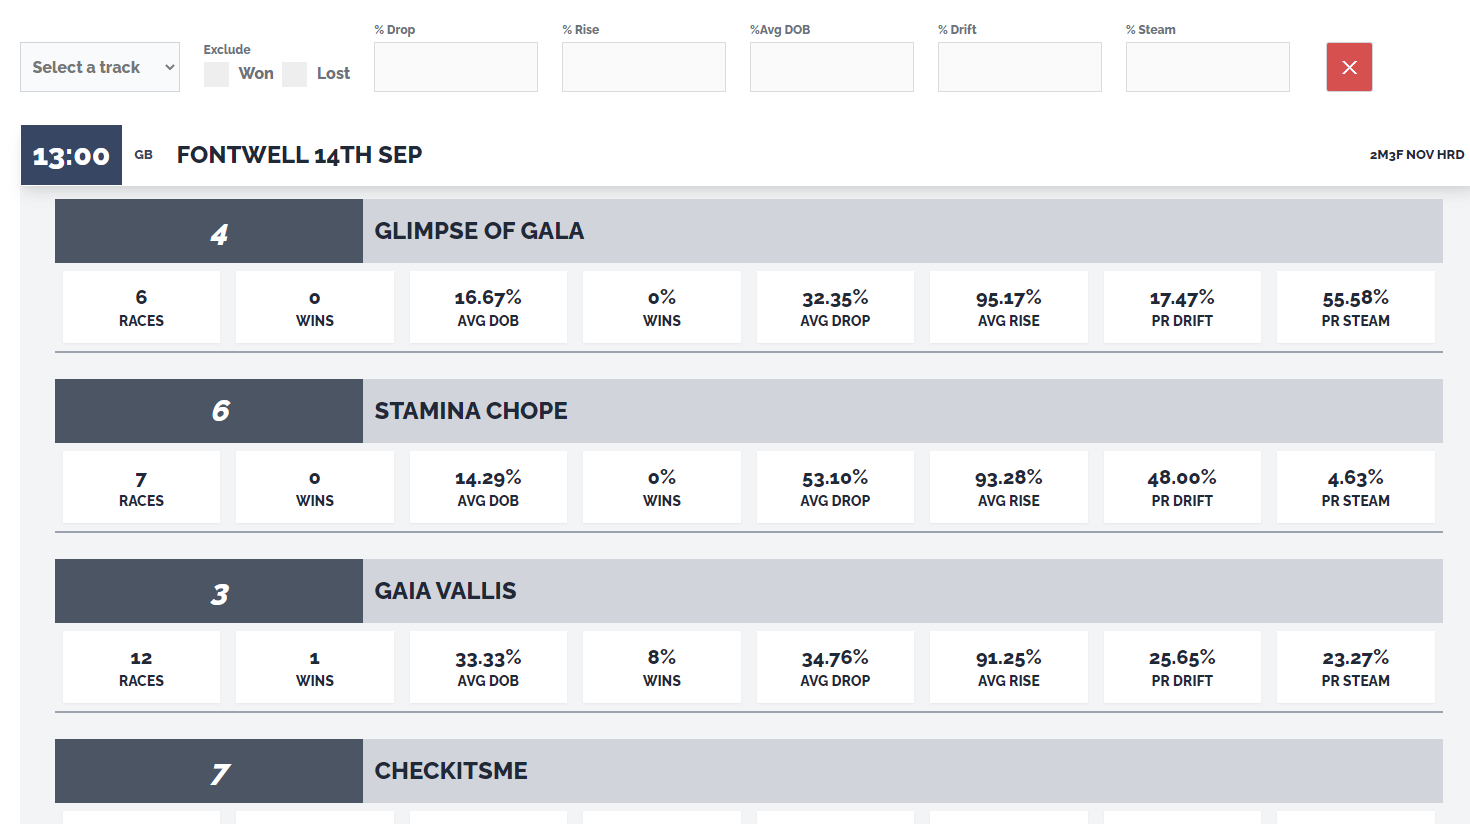
You can see that Glimpse of Gala and Stamina Chope are relatively comparable here with a similar amount of historical information. You can go one step further and look at this information specifically on the next level, as shown below.
Bottom Level – Individual Horse Statistics
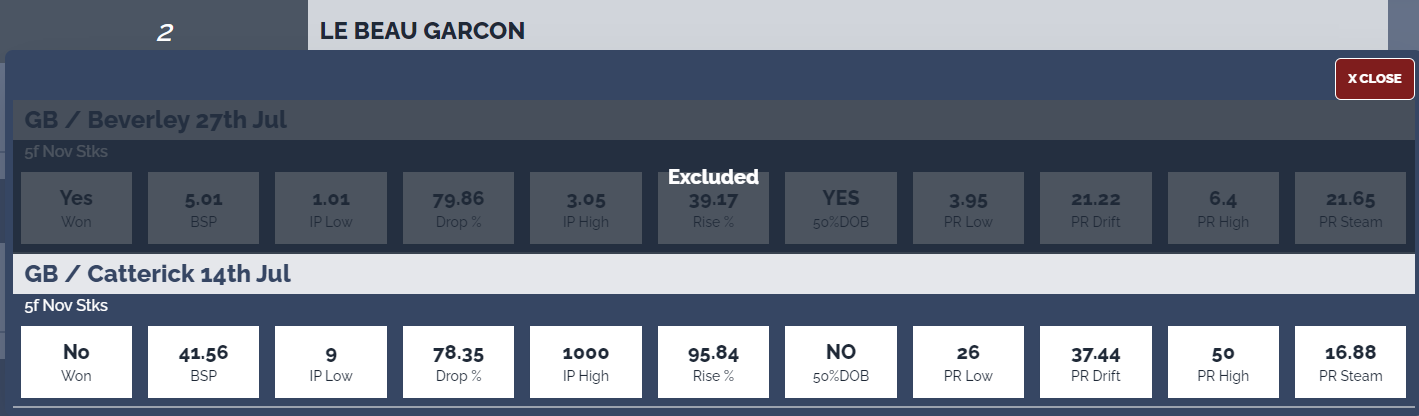
Clicking on an individual horse within the data will show you that horses historical information, one performance at a time.
In the example below, we have clicked on Glimpse of Gala. You may notice there are additional columns of information at this level. This is because these numbers are not averages, they are the specific results for each individual performance.
As an example, Glimpse of Gala raced at Aintree on the 8th of April. The Betfair Starting Price (BSP) was 182.21 and the lowest price traded in running was 29, which equates to an 84.08% price drop.
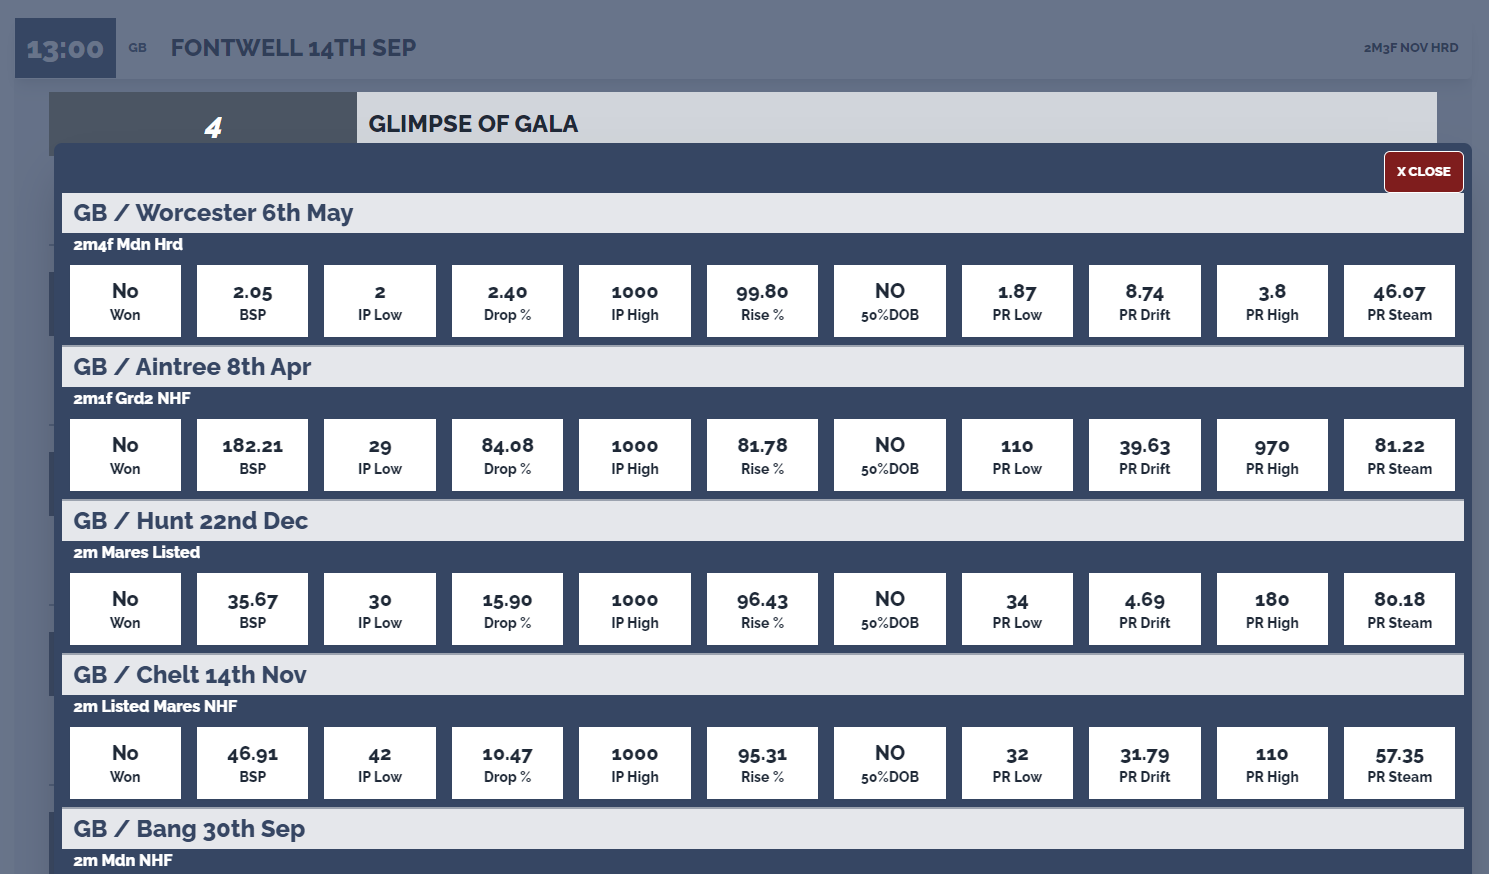
Clicking the race title takes you back to the previous level.
To see how we suggest using this information too, please click here.